Current Projects
Ice shelves and climate variability
Ice shelves are the canaries in the mines of climate change. West Antarctic ice shelves in particular, have undergone significant ice mass loss over the last few decades, and we suspect events like the collapse of Larsen B will become more frequent.
Although collapsing ice shelves do not themselves contribute to sea level rise (since they are already floating), they do however act as buffers to slow down the flow of grounded ice in abutting ice sheets (the real heavy hitters of sea level rise). Lose the shelf, and the ice sheet begins to destabilize. What's more, healthy ice shelves are coated with a thick snow-to-ice layer called the firn, which acts as an insulator for the solid ice beneath it. Lose the firn, lose the shelf, lose the sheet (this is, among a few other factors, what happened to Larsen B).
I am currently studying a novel approach to seismically monitor the firn, and evaluate its response to climate forcing on the Ross Ice Shelf, Antarctica. This involves looking at long records of ambient seismic noise, which feature unique near-surface trapped resonance signatures, that look (and sound!) a bit like a dissonant choir. Our initial findings, published in late 2018, caused a bit of a stir (here's the late Night show with Colbert segment about it for a giggle).
The two images on the bottom right show a few tidbits of that research: The colorful panel represents the amplitude spectrum (as a spectrogram of continuous seismic noise) showing amplifications at certain frequencies (the red lines/blobs) that drift around when impacted by surface forcing (in this case, large passing storms that deposit snow and rearrange structures). This drifting behavior can be used to understand what the firn is "feeling" as a response to anything happening on the surface (for instance, it is also responsive to swings in temperature!)
These spectral peaks also feature anisotropy (that slight offset of the blue and red lines in the bottom panel of the third figure), which is to say, seismic waves travel faster in one direction than another, pointing to preferential structures in the snow and ice (like directional crevassing and plastic deformation and stretching of snow).

The Ross Ice Shelf, in all its quiet glory

NASA study of mass loss from West Antarctic ice shelves over the last few decades

Variation of firn resonance modes as impacted by winds and steady state conditions. Right panel: Spectrogram of resonances modified by passing storms.
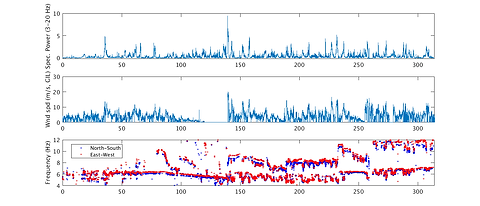
Wind and spectral power, and a clear view of anisotropy (splitting) in the resonance modes.
All things volcano!

Using icequakes to recover inter-station impulse responses on Erebus volcano
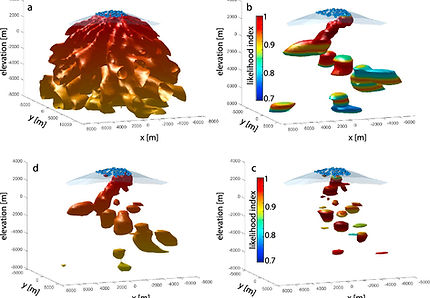
Advanced confocal image of Erebus volcano derived from the first few singular values of the reflection matrix (Blondel et al 2019)
For a seismologist, volcanoes are essentially end-member structures in terms of complexity, dynamic behavior, and general method-breaking targets. Most conventional methods of imaging tend to fail on volcanoes for various reasons: Extreme topography complicates tomographic efforts; extremely short mean free path statistics turn any input source into an incoherent mess over very short distances, and a volcano's dynamic behavior means known structures may shift and change over many different time scales.
UTEP is currently the host for the Mount Erebus Volcano Observatory (MEVO), and we are in the process of setting up a data and code portal for this unique volcano that serves as a natural laboratory.
The extreme scattering structure of Erebus volcano is currently being used to develop and test a specialized avenue of scattering-based imaging (in much the same way as a baby ultrasound works, except with the advanced capability of "seeing" through a dense fog of other structures). A few recent studies on this can be found in my publications section.
Furthermore, volcanoes generate all sorts of interesting signals, from eruptions, tremor, icequakes, environmental forcing like storms and accumulation/melt cycles, iceberg tremors (in the case of Erebus), and local/teleseismic signatures. As such, continuous seismic recordings offer unique opportunities to tune unsupervised learning algorithms that are able to blindly classify various kinds of transient signatures, in a sort of clustering of behaviors inherent to any raw data set. Many other such projects of opportunity exist with this flexible and soon to be real-time dataset.
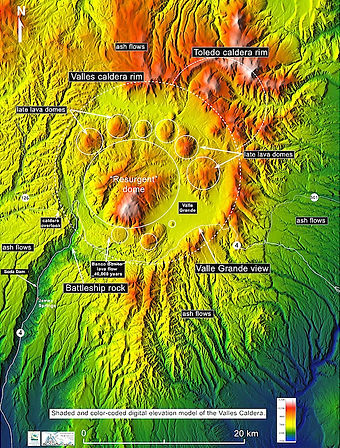
Along with scientists at the University of New Mexico, we have also recently deployed a large nodal seismic array through the Valles Caldera, super-volcano in NM, with a goal to better understand its magmatic structure (which largely remains a mystery to date). The field work and data have already been performed using a joint PASSCAL/UTEP instrument pool, and we are in the process of writing an NSF proposal to fund graduate student research on the subject. We plan to bolster shear wave models (in progress at UNM) with receiver functions and autocorrelations of teleseismic coda to better constrain the depth of interesting structures.
The Valles Caldera supervolcano
Desert seismology, and listening for wind and particles
This recently funded project through the Army Research Lab (ARL) aims to explore links between wind turbulence, airborne particle budgets, and the ambient seismic spectrum for dryland morphologies. Recent forays in physical modeling have produced a number of closed-form models of the seismic impact of particle and debris flows generated by river sediment transport and avalanches. These models help predict the shape of the resulting spectrum due to spatial and temporal averages of individual particle impacts.
Particularly for dryland morphologies, this principle also applies, but the phenomenology is likely far more subtle and difficult to constrain (i.e., the particles are saltating and bouncing around in the wind, but each particle carries FAR less kinetic energy than a boulder rolling downhill, for instance). Particle and dust transport is however a very important aspect of monitoring erosion, air quality, and vulnerability in desert climates. A direct link to ambient seismic signals, with the added advantage that seismometers do not directly interact with the atmospheric system, is thus a desirable objective, but requires considerably more cross-disciplinary data.
As such, we have partnered with the Meteorological Sensor Array in the Jornada Range, NM, which features a very advanced battery of meteorological sensors aiming to model fluid dynamics of high-wind turbulence, to deploy a joint array of seismic nodes and real-time particle sensors to better constrain the subtle relationships between wind shear, turbulence, particle saltation and budgets, and the ambient seismic spectrum, with a goal to study potential empirical laws dictating particle transport from seismic signals alone. This project will employ a postdoc and partially fund several graduate students. Contact me for more info!
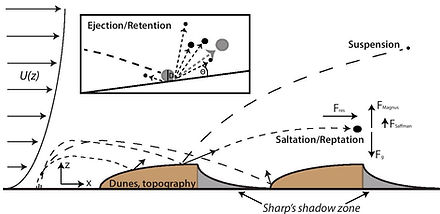
Schematic of particle saltation under the influence of a wind shear profile

Proposed seismic array and MSA meteorological array in the Jornada Range, along with example instrumentation

Feedbacks and other effects relating atmospheric forcing to particle budgets and the ambient seismic spectrum
Passive ionospheric sounding using continuous GNSS satellite recordings

NASA image of total electron content in the ionosphere

Pulse compression for a visible satellite: The peaks represent where the source code lines up with the received data. The long period variability is the mapping of the Doppler shift (due to a moving satellite) to the imaginary portion of the signal.
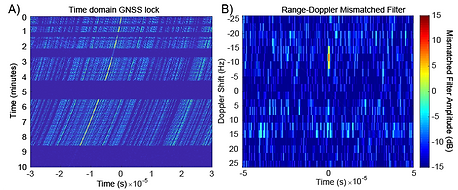
Most fields involving signal processing have a few processes in common. Active source seismic imaging, bistatic radar imaging, and satellite GPS location workflows all employ fundamentally the same basic process: pulse compression. When a source signal is exactly known (as in vibroseis seismic surveys and GPS Gold code signals), a simple cross-correlation of this source signal with a received noisy signal results in a peak where the source and received signals line up, and any "echoes" of the source code from reflections of objects along the way result in smaller, delayed peaks. This train of peaks can be very complicated for real world data, but can be related to the impulse response function of the medium (that is, what the medium would return if your source input was a perfect delta spike). Everything around you, from the earth to the atmosphere to a rocket engine, has a unique impulse response between any two points measured. This can ultimately be leveraged to perform imaging of the structure through which your source signal traveled before getting to your receiver.
I am in the process of using continuous GPS satellite data (in which each of the 32 GNSS satellites produces its own, unique semi-random signal that repeats every 1 ms) to construct repeating impulse response functions for the ionosphere, whereby changes in time of these functions signal variations in electron content (which is the main obstacle to clean transmission of GPS signals at typical carrier frequencies). Surges in activity in the ionosphere should then become directly visible in range-doppler images, where we essentially treat the satellites and receivers as a bi-static radar experiment.
This research is currently being performed in collaboration with Lincoln Labs, and MIT Haystack radar observatory, with which we deployed a test data set in the summer of 2019 to capture ionospheric perturbations due to sunrise events. A follow up NASA proposal will be written on the subject pending the completion of our early publication.
A pulse compression lock of a satellite over 10 minutes, and a range-Doppler image featuring the main lock and a number of other off-maximum structures.
Machine learning, data topology, applied math stuff, and medical imaging
This section will expand as I manage to find time and generate neat results. If you have interest in any of these subjects, feel free to contact me at your leisure.
